Showing posts with label GDP. Show all posts

Tuesday, 16 May 2023

No 262: Round Up of UK Economic Data

 LOTS of important UK macro data in the last week or so.

(1) The Base Rate of Interest was put up from 4.25% to 4.5%.

https://www.bbc.co.uk/news/business-65554797

(2) UK GDP Growth in Q1 2023 was only 0.1%.

https://www.bbc.co.uk/news/business-65562888

(3) ***TODAY*** UK unemployment (Q1 2023) has gone up from 3.7% to 3.9%.

https://www.theguardian.com/business/2023/may/16/uk-payroll-fall-unemployment-rate-rises

Referring to such "fresh" data is sure to impress the examiner! Even better if you read the articles above and absorb some more detail.....

Wednesday, 15 February 2023

No 257: Many Important UK Economy Figures This Week

 A BUMPER week for UK economic data. Here is a summary, but make sure you also read the full article given for each one:

UK GDP Growth was -0.5% in December. But over the quarter (Oct, Nov, Dec) it was 0%, so the UK avoided (just!) being in a recession. uk q4 gdp

Wages increased by a near-record 6.7% in Q4 2022, but this is still far below inflation. Unemployment remained extremely low - 3.7% for Q4 2022. uk wages / unemployment

Inflation for January was 10.1%, lower than the 10.5% of December, but still near record high. A particular worry is inflation in food and drink prices, which was 16.7%. uk jan inflation figures

Tuesday, 31 January 2023

No 250: Two Important UK Macro Announcements

JUST announced this morning, two very important stories.

Food inflation in January was 16.7% (see here for full story). in other words, food prices in UK this month are 16.7% higher than they were in January 2022. For an average family, this equates to almost £800 a year higher food bills. Although rises in other prices are slowing down, news like this is sure to mean that the Bank of England MPC will again raise its base rate of interest on Thursday.

Meanwhile the International Monetary Fund (IMF - a global institution set up to provide funds for economic emergencies) has just published their 2023 forecasts for economies around the world (see this BBC article). It names the UK as the only major advanced economy that will have a recession in 2023, forecasting growth to be -0.6% for the year. Even the Russian economy is predicted to grow in 2023.....
The Chancellor, Jeremy Hunt, has said this shows the UK is subject to the same pressures that all other countries are under, but if so, why is the UK forecast to do worse than them? What individual factors is the UK experiencing that other similar countries are not?

Try to think of some. Later on in the week I will blog about what I think these factors are, and we can see if we agree. 

Sunday, 27 February 2011

No 183: The Provinces of China Compared to Countries

THIS infographic from "The Economist" compares Chinese provinces with similar countries, in terms of GDP, GDP per capita, population and trade.

(To see a similar map about the USA see Post 37).

Sunday, 23 January 2011

No 175: About Loose and Tight Policy

AS YOU will know if you took the Module 2 exam on Wednesday, the first question in it asked about "loose" monetary policy.

It occured to me that the terms "tight" and "loose" may not be that familiar to you, since they don't always appear in textbooks.

But then I remembered all of you are of course doing lots of Economics reading, so have looked at this week's Economist........


This extremely relevant article (which you should read and all my students will be reading) starts:

THE script for 2011 had been well rehearsed. The Treasury’s fierce fiscal retrenchment would  undoubtedly hurt the economic recovery. But the Bank of England would add balm by maintaining an extraordinarily loose monetary stance. Just three weeks into the new year, however, surging inflation has disrupted the story. The worry is that this could endanger the recovery by forcing a premature tightening in monetary policy.

So exactly what do these terms "loose" and "tight" refer to, and in which situation can they be used appopriately to describe government policy?
The first thing to say is that "loose" policy is also often referred to as "expansionary" policy, and that "tight" policy is often called "deflationary" policy.

The second basic concept is that loose and tight as terms can be used to refer either to monetary policy or fiscal policy.

Imagine a government controls 2 "taps" called a monetary tap and a fiscal tap. 

The monetary tap works mainly by controlling credit in the economy through manipulation of interest rates.

The fiscal tap works by alterations in taxation, government spending, and any borrowing it requires.

Both taps influence the amount of demand that flows through the economy, which in turn affects the amount of goods and services produced, and therefore also the levels of profit, wages and jobs.


Here, the government (or in the UK, more accurately the Bank of England) has loosened the Monetary Policy tap. Lower interest rates encourage households and firms to take out credit and then spend it, increasing the flow of demand in the economy.


Here, fiscal policy has been loosened. Taxes have been cut, and/or government spending has been increased. This gives people more money, therefore adding to the flow of demand.


During the Credit Crunch, various factors - lack of bank lending, falling wealth, plunging confidence, lack of profits - all led to the total (or aggregate) level of demand being at an extremely low level.


So, it is generally agreed that the right government action in this situation to use both loose monetary and fiscal policy. It is hoped that the economy can recover from recession by the government causing demand to increase in the economy.


This is the current situation in the UK. The government has decided to tighten fiscal policy.

In its original (Keynesian) form, the idea was that loose fiscal policy in bad times would be paid for with money the government had saved up in the good times. Few governments do that now, meaning that money must be borrowed to pay for it.

However, at certain point, too much government debt endangers the ability of governments to borrow money in the future. This would be a disaster, since government would be unable to pay even for its most essential services such as health care and education.

Therefore, it was decided to tighten the fiscal policy tap. But some economists fear that fiscal policy has been tightened too early, and that this will damage the recovery.


If a recovery becomes a boom, a government will tighten monetary policy also. This is to avoid demand overflowing. If there is demand which is not realised (that is, there are not enough goods and services for everyone who want them), prices shoot up.

The resulting inflation is seen by many economists as an economic problem which can be even worse than unemployment.


There is increasing inflation in the UK at the moment, and this is worrying. However, the cause is not too much demand in the economy. Instead, it is due to rising prices of essential commodities such as food and oil, as well as a rise in VAT (part of the tightening in fiscal policy).

The government could decide to tighten the monetary policy tap to combat this.

However, the fear is that the economy is not strong enough to continue to recover by itself with both tight monetary and tight fiscal policy.

As with most economic policy decisions, it is not so much the policy you use as the time that you decide to use it.

Wednesday, 5 January 2011

No 173: Top 10 Economics Stories of 2010


CLICK on this link to get to a sideshow from the "Daily Telegraph" of its top 10 economics new stories of 2010.

Here is a list of which stories they have included:


1. Deficit, debt and austerity worries
2. Government debt problems for European countries
3. Currency wars
4. Global imbalances in trade
5. China's continued growth
6. Difficulties with job creation
7. Inflation and interest rate decsisions
8. Problems for the Bank of England's monetary policy
9. The formation of the Office for Budget Responsibility
10. Unpredictable UK growth

These stories will be the starting point of our classes on Macroeconomics this coming term (5 more days of holidays - use them wisely and enjoy - I myself am mostly watching cricket!).

Therefore, please make sure you have a look. There may even be an exciting quiz about them next week.....


If you want more, here is a link to the Telegraph's Top 10 Banking Stories of 2010.


And if you'd like even more, this is a link to "The Week" magazine's Most Newsworthy Dogs of 2010, including the sad story of Target, the war hero dog :,(


Wednesday, 29 December 2010

No 170: GDP Forecasts for 2011

FROM "The Economist".....


Wednesday, 8 December 2010

No 166: Next Four Student Stories

FOUR more excellent news story summaries from A2 students. Good work!


AMERICA'S JOBLESS RECOVERY by Abdul Abdulrahim

Nearly in every sector the U.S. seems to be picking up pace, spending has been become strong, and the latest figures on pending home sales suggest that even housing markets may be coming back from their deep slump.

The growth seems to be everywhere except one of the key areas —labour markets. Employment in America turned in a surprisingly poor performance in November, indicating that recovery is not creating enough jobs.

The unemployment rate rose to 9.8%, its highest level since April and close to the 10.1% recession peak. At 15.1m, the number of unemployed workers rose back to its April high (though some of this increase was due to new entrants to the labour force).

Many of these workers are now rely on unemployment benefits. Congress has yet to reauthorise the emergency benefits package, as it has done so many times through the recession. Some 2m jobless workers may lose benefits by the end of 2010, and perhaps 4m or more will lose them by April (The Economist).

The November figures may be revised up in future months to show a better performance (like the previous months). The U.S. labour markets has yet to generate job growth sufficient to bring down the unemployment rate of the country. However the pace of recovery has been improving. All the same, policymakers in Washington considering the extension of unemployment benefits and tax cuts should pay attention to the obvious weakness in labour markets. They can and should make sure that November's number remains an anomaly(out of what is expected).

 (http://www.economist.com/blogs/freeexchange/2010/12/americas_jobless_recovery&fsrc=nwl)


OIL PRICES REACH POST-CRISIS TWO-YEAR HIGH by Eunice Aw

Oil prices reached a record high since the financial crisis in 2008.

The factors that contributed to this rise in oil prices included an increasing demand for oil due to the global economic recovery and the cold weather.

The rising demand is also due to the weakening of the US dollar. The weak US currency makes oil less expensive as it increases the purchasing power of currencies that gain in value against the dollar. Hence, the demand for oil increases. However, the producers may restrict the supply of oil as they are earning less profit from the US dollar. This results in a rise in oil prices.

http://www.bbc.co.uk/news/business-11917152


SPANISH AIRPORTS FACING POST-STRIKE BACKLOG by Dheeya Rizmie


The unexpected, unofficial strike of air traffic controllers in Spain has lead to the forced cancellations of numerous flights, both departing and arriving in Spain, with more than 250,000 people being affected. The strike came after the government decided to introduce a period of austerity (in order to reduce their budget deficit) which may severely affect the wages of controllers. This decision came after an ongoing dispute acout their work hours.

http://www.bbc.co.uk/news/world-europe-11921539


FUTURE UK GROWTH by Valerija Artemjeva


The economy will grow by less than expected in 2011(the UK's GDP was predicted to be 2.2% but now the it is predicited to be 1.9%), but growth in 2012 will be better than predicted, the British Chambers of Commerce forecasts. It upgraded its GDP growth forecasts for 2012 from 1.8% to 2.1% - but that was still significantly lower than the OBR's 2.6% estimate.

http://www.bbc.co.uk/news/uk-11920548

Monday, 6 December 2010

No 164: First Four Student Stories

SO HERE are the first of the summaries written by my A2 students about recent economic stories. Good work everyone!

EUROPEAN COUNTRIES AND THE EURO by Queena Wong

Countries in Europe like Spain, Italy, Portugal and Ireland are still in recession. Confidence in these countries decreased as the cost of insuring government debts rose sharply. The cost of insuring indicates the high risks of government repayments. This has led to the Euro falling to a 10-week low.


(See

   
IS HAPPINESS ALL ABOUT MONEY? by Yana Geshko


In the article ideas about human well-being and income are discussed. Should government put people's happiness above people's prosperity as the aim that drives their policy- making decisions? Though peoples' answers don't show that money is everything, they usually make a decision relying on the possibility to save or earn money. 


(See http://www.economist.com/node/17578888 )


CAMERON'S HAPPINESS INDEX by Iris


David Cameron has asked the Office of National Statistics to measure the country's "general well-being" in terms of what is known as the index of happiness. The government is intending to use this statistical information when it comes to policy making.However,this rather creative new strategy is not favoured by the majority of people who is concerned about the feasibility of this,because it is not only difficult to define "happiness",but is also time-consuming to collect data from a large and representative sample.


 CADBURY AGREES TO KRAFT'S TAKEOVER BID by Rachel Yoo

Cadbury will benefit from the supply chain of a larger company.
For example, its addition to the Kraft will allow the combined company to have an even a broader reach around the world.
Also, there is a big chance to generate cost savings.
However as Cadbury, the 186-year-old British company, was acquired by an American company there were public protests, asking to “Keep Cadbury British”.

 http://stocks.investopedia.com/stock-analysis/2010/What-Happens-When-Kraft-And-Cadbury-Merge-KFT-CBY-WEN-MCD-TGT0127.aspx?partner=tickerspy


Saturday, 27 November 2010

No 161: Strange Story 3 - The Irish Government Cheese Plan

THE world economy grew more in the 1990s than in any other time in human history.

For example, between 1995 and 1997, the world's GDP grew by more than during the 10,000 years from 8100 BC to 1900!!!

Of all the countries of the EU, the Republic of Ireland gained the most. Unemployment fell from over 15% to 5%. GDP growth averaged 7% each year from 1994 to 2004. GDP per capita rose from 66% of the EU average in 1986, to 111% of EU average in 1999 (significantly higher than in the UK).

The government policies that seemed to have led to this success were deregulation, encouragement of foreign investment, and very low corporation tax rates of 11% (whereas in the USA, it is 35%)

However, as the graph below here shows, the fall of Ireland during the Credit Crunch has been just as spectacular.

In all, GDP fell by 13.5% in 18 months.

The average wealth of a household fell from E95,000 in 2006, to E51,00.

The Irish banks needed billions of euros of help from the government.

In 2010, the government will borrow funds equivalent to 32% of the whole country's production.

In recent weeks, the country's situation has got so bad that the Irish government has been forced to accept 85 billion Euros of loans from the EU and the IMF.

At the same time, they announced 10 billion Euros of cuts in government spending, and 5 billion in tax rises.

Understandably, the people of Ireland are angry, as you can see in this picture:


But, have no fear people of Ireland, because your government has thought of a plan, and although it may not solve all the problems straight away, it is will surely make everyone feel much better. The plan is....


CHEESE!


That's right, the Irish government has bought a very big piece of cheese and every household in the country will get some of it!


Brendan Smith, the agriculture minister, said the plan was "an important means of contributing towards the well-being of the most deprived citizens in the [EU] community".

However, the plan has made some Irish people extremely angry:


One caller to a radio show said: "Have they taken leave of their senses? It's not cheese that people who have lost their jobs that people are worried about, it's about how they're going to tell their children or grandchildren that Santa has very little money."


"What are they going to tell their children and grandchildren: that Santa has cheese instead?"
Another said: "This is just crackers. The scheme is full of holes. This is the last straw - it's really grated on the whole community." 


Further Reading

Friday, 26 November 2010

No 160: California Against The World

HERE's a very nice infographic, helping us to remember just how important the US economy is to all of the rest of us.

Before we see it, just a reminder of the biggest economies in the world:

1 United States $ 14,120,000,000,000 2009 est.
2 China $ 8,818,000,000,000 2009 est.
3 Japan $ 4,149,000,000,000 2009 est.
4 India $ 3,680,000,000,000 2009 est.

The important point here is not that USA IS NUMBER 1!!!!! (As American like to say.)
 
It is more that the US economy is about the same size as China's, Japan's and India's added together.
 
No wonder that the Credit Crunch proved the old proverb still seems to be true: "If the USA sneezes, the rest of the world catches cold."
In fact, as the infographic shows, even individual states of the US have enormous economic power:

 Click this to see it: California Against the World Infographic


You may also like to look at one of my favourite ever maps, showing US states and the countries whom have an equivalent size to them - click on the link below:

Post No 37: Your country compared to US states

Wednesday, 6 October 2010

No 149: Of billions, trillions and debts

I'VE been looking for some ways to visualise the huge amounts of money that governments owe.

Remember that "budget deficit" refers to the money a government borrows over a year, wheareas "national debt" is all of the money a government owes from borrowing in the past.

I've already posted about the UK debt clock (see Post 67 and http://www.debtbombshell.com/) and the Billionpoundagram visualisation (see Post 67 and billion-pound-gram).

Here's an article about current UK government borrowing: uk record borrowing. This is the key information:

"TheUK's budget deficit rose to the highest level since at least 1993 reaching 15.3 billion pounds in August....

"...economists expect the deficit to be .... 149 billion pounds in 2010."

This sounds a lot but it's hard to imagine. Economists usually compare these big numbers with the total value of all production in the country. On this measure, the deficit for 2010 will be equivalent to about 10% of UK GDP. In other words, the government borrowing for this year will be the same value as 10% of all the goods and services made in Britain.

However, a billion of something is hard for us to imagine. This video may help....


Trying to find visualisations of a billion then led me to trying to do the same about a trillion. Whenever I hear the word "trillion", I often think about the US national debt, currently about $13 trillion!

Here is the debt clock for the USA: http://babylontoday.com/national_debt_clock.htm.

I am now going to pause writing this blog and see how long the clock will take to increase by $1 million.....


Right, back again, it took 22 seconds. Therefore, US national debt is increasing by $1 million every 22 seconds!

Much of this is interest payments, calculated to be around $383 billion this year. Of course, this leads to an enormous opportunity cost where money that could have been spent on providing government goods and services is spent on interest payments. But also remember that if a government doesn't pay its debts (known as "defaulting") it won't be able to borrow money in the future, or if it can, it will be at even higher levels of interest. And then it won't be able to pay back the interest so they can borrow more money to make the interest payments.......

There is a clock in New York which shows the US National Debt. A couple of years ago there was a problem with it:


If a billion is hard to imagine, a trillion must be even more difficult.

These 2 visualisations may help:


One last number to draw attention to: the total cost of the government spending caused by the credit crunch so far has been .... $10,000,000,000,000 (10 trillion).

Although actually this is only up July 2009 (see this BBC article).

Recently, some economists have been arguing that the Bank of England needs to put even more money into the economy to make sure we do not fall back into recession (time for more QE?).

Monday, 27 September 2010

No 147: Don't live here!

A NEW survey claims that the UK is the second-worst European country to live in .

http://www.uswitch.com/news/money/uk-worst-place-to-live-in-europe-uswitch-quality-of-life-index-890419/


According to the article:

"People in the UK pay the highest prices for food and diesel, yet the government spends below the European average (as a percentage of GDP) on health and education. We also work longer hours, retire later, receive less annual leave than most of our European counterparts and get less sunshine along the way – not to mention the fact that we can expect to die two years younger than our French counterparts."

Therefore the message to you would appear to be: get your excellent university degree from the UK, but don't stay here afterwards!

However, as usual, a closer look at the statistics is interesting, to me at least! Firstly, only 10 countries are included in the study. Secondly, take a look a list of indicators used in the research:

  1.  net household income after tax
  2. VAT
  3. average working hours per week
  4. hours of sunshine per year
  5. retirement age
  6. number of days holiday per year
  7. education spending as % of GDP
  8. health spending as % of GDP
  9. fuel unleaded gasoline per litre
  10. fuel diesel per litre
  11. gas per GJ
  12. electricity per kWh
  13. alcohol prices index
  14. food prices index
  15. cigarette prices per 20
  16. life expectancy 
I have no problem with the use of stats number 1-8 and 16. What worries me is that there are 7 out of 16 indicators about cost of goods and services, which appears unbalanced. Thus, a country like Poland, which has by far the lowest income, scores well in the survey because its prices are so low.

Can you please notice any other possible problems which can help save my wonderful country from being called the 2nd worst place to live in Europe?

Sunday, 29 August 2010

No 145: World Economics News

UK CPI INFLATION for July was 3.1% down from 3.2% in June. The Bank of England stated that they could not see it falling to the 2% target this year.

The ONS (Office of National Statistics) revised Q2 GDP Growth up to 1.2% from their earlier estimate of 1.1%. This was the fastest rate of quarterly growth in the UK since 2001, but economists are expecting a slower rate during the rest of the year.


(See here for more.)

Q2 GDP was revised in the USA, but downwards, from an estimate of 2.4% to 1.6%. This has led many to expect more quantitiative easing to be introduced soon by the US government and Federal Reserve.

Germany grew in Q2 by 2.2%, its highest ever rate since reunification in 1990.

However, Greece (1.5% fall in GDP), Spain (only 0.2% rise) and Japan (only 0.4%) all had disappointing growth figures. For Japan, this was also the month in which it fell behind China's total GDP and therefore dropped to being the world's third biggest economy. Income per person in Japan, however, is still ten times as much as in China.

Monday, 16 August 2010

No 141: Japan no longer world's second biggest economy

A LONG predicted event has finally happened: China is now officially the world's second biggest economy.

For more details read:

http://uk.finance.yahoo.com/news/japanese-economy-slips-to-third-in-the-world-skynews-4d6c38cb3df5.html


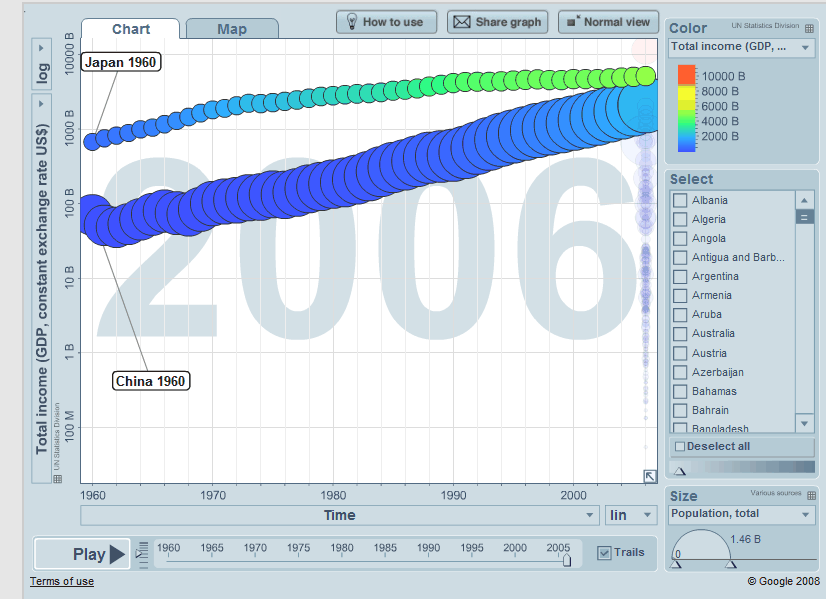
 This news might not seem so surprising given that Japan has had low or even negative growth over the past ten years, while China has averaged 10%.

Nevertheless, the gap between the two countries' GDP 30 or 40 years ago was huge. Click on the next link, and you can see an interactive graph I made on gapminder that shows this:

www.bit.ly/cDtgEa

Here is a screenshot of what it looks like:


Try dragging back the arrow at the bottom to 1960 then press play to see how GDP changed. You can also click on other countries in the panel on the right to see how they did in comparison.


It's worth having a good play around with this - we will be using the gapminder software a lot in my classes during the next school year.

Saturday, 7 August 2010

No 140: World Economic News

UK GDP expanded by 1.1% in the 3 months up to the end of June, a better performance than many expected.
This is compared to the 0.3% growth in quarter 1 of this year.

 Meanwhile South Korean growth slowed to 7.2% in 2010 Q2, from 8.1% in Q1.

USA growth dropped to 2.4% Q2 from 3.7% Q1.

Export figures boomed for India (up by 30.4% so far this year) and Malaysia (17.2% more compared to this time last year).

Unemployment fell in June in Brazil (to 7%) and Mexico (from 5.4% to 5.1%) but in the Eurozone stayed at 10%. Spain's jobless figure is still 20%.

Inflation decreased in Russia (down to 5.5% from 5.8%) and Switzerland (now 0.4%).

The generally positive news is reflected in the statistics for World GDP:

Wednesday, 4 August 2010

No 136: Friend of this blog 1

NICK from Geognos website (see Post 65) has just contacted us about some very useful new information he has put on his site.

If you go to http://www.geognos.com/geo/en/countries-list-menu/Economy.html


you will see this page:


There is a good relevant selection of information here, especially with relation to the Credit Crunch.

For instance, here is the first data visualisation, about government revenue and spending:


(I've only made a screen shot of the top ten.)


This is the 4th data set, about different countries' GDP and how much comes from agriculture, industry and services. As you can see, it is currently organised alphabetically.

Clicking on the relevant column arrow reorders this to show, for instance, those countries who have the largest part of GDP from industry:


Don't be fooled by this - it ISN'T saying that, for example, Iraq has a lot of manufacturing industry, just that in comparison to agriculture and services, by far the largest area of the country's output in from industry. It's probably 62.8% of not very much!

If I could be allowed one slight criticism, it would be good to know the sources of the data Nick has used.

Nevertheless, this is a very good resource. Play around with it yourselves and let me know if you find something interesting or surprising.

Sunday, 25 April 2010

No 116: New growth figures

FRIDAY saw the publication of Q1 2010 GDP figures, which completes a new set of not very positive economic indicators.


(Read full article here.)

Yes, the figure may be revised, but I very much doubt if it will go up to anything above 0.5%.

So, if we review the indicators again with how they have changed, what comments would you make about the current state of the UK economy?

  • CPI INFLATION: 3.4% (MARCH)  Up by 0.4%
  • UNEMPLOYMENT 8% (MARCH) Up by 0.2%
  • GDP GROWTH 0.2% (Q1 2010) Down by 0.2%
  • TRADE BALANCE -£2.1 BILLION (FEB) Down by £1.7billion

Wednesday, 21 April 2010

No 112: First the good news......

A COUPLE of good signs in the UK economy.

First, regarding business confidence:


Full article here.

And this report by a powerful international organisation argues there will be relatively strong UK economic performance in the second half of 2010:

Read more here.

A couple of possible problems. Confidence in the economy, unfortunately, can rapidly disappear if something goes wrong later. Also, while Britain's growth may exceed that of other similar countries this year, its GDP fell by more than most of them during the recession, and many of these other nations are more advanced in their recovery.

Friday, 2 April 2010

No 101: Update to Key Information

.

THERE have been a few changes to the UK macroeconomic indicators.

First was a fall in the rate of inflation in February, partly due to falling home fuel costs.

Second, another update that slightly increases 2009 Q4 GDP growth.

Third, a small fall in unemployment that has not changed the overall percentage.

So now the figures are:

  • CPI INFLATION: 3.0% (FEB)
  • UNEMPLOYMENT 7.8% (FEB)
  • GDP GROWTH 0.4% (Q4 2009)
  • TRADE BALANCE -£3.8 BILLION (JAN)
I don't want to repeat myself - I'm sure it bores you - but I  am disappointed when some students don't know these numbers. It will help you to get a better grade if you remember them!